
Choose the racing day#
The Dashboard opens on the current racing day. In a development or demonstration environment, a populated historical date may be shown instead.
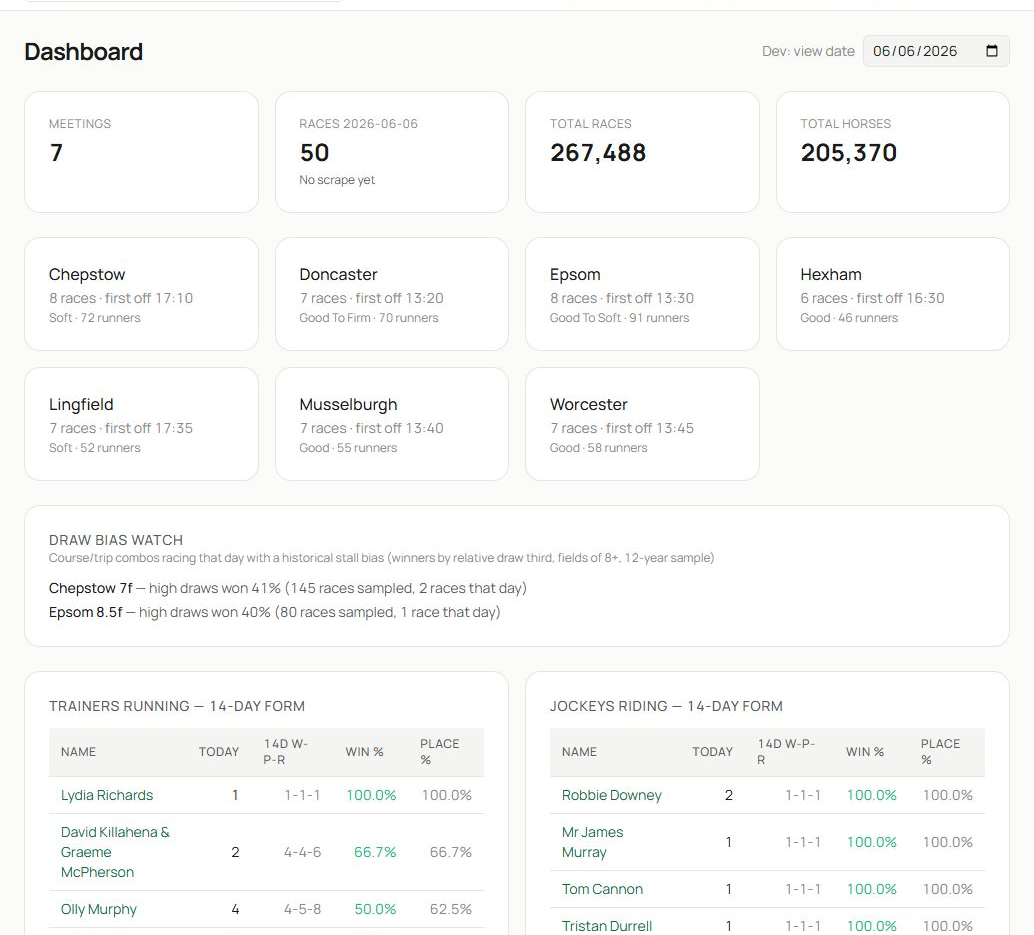
- Use the date control to move to another available card.
- Read the summary tiles first: number of meetings, races and horses. These tell you the size of the day before you begin.
- Meeting cards show the course, race count, first-off time and surface or going. Select a meeting to continue into its races.
- Draw Bias Watch highlights courses and trips where the historical sample points to a stall advantage. Treat it as a research prompt, not a standalone selection rule.
When a day has no published card, the summary remains empty. Move to another date or return when declarations are available.
Find active trainers and jockeys#
Scroll below the meeting overview for short-term connection form and the main figure watchlists.
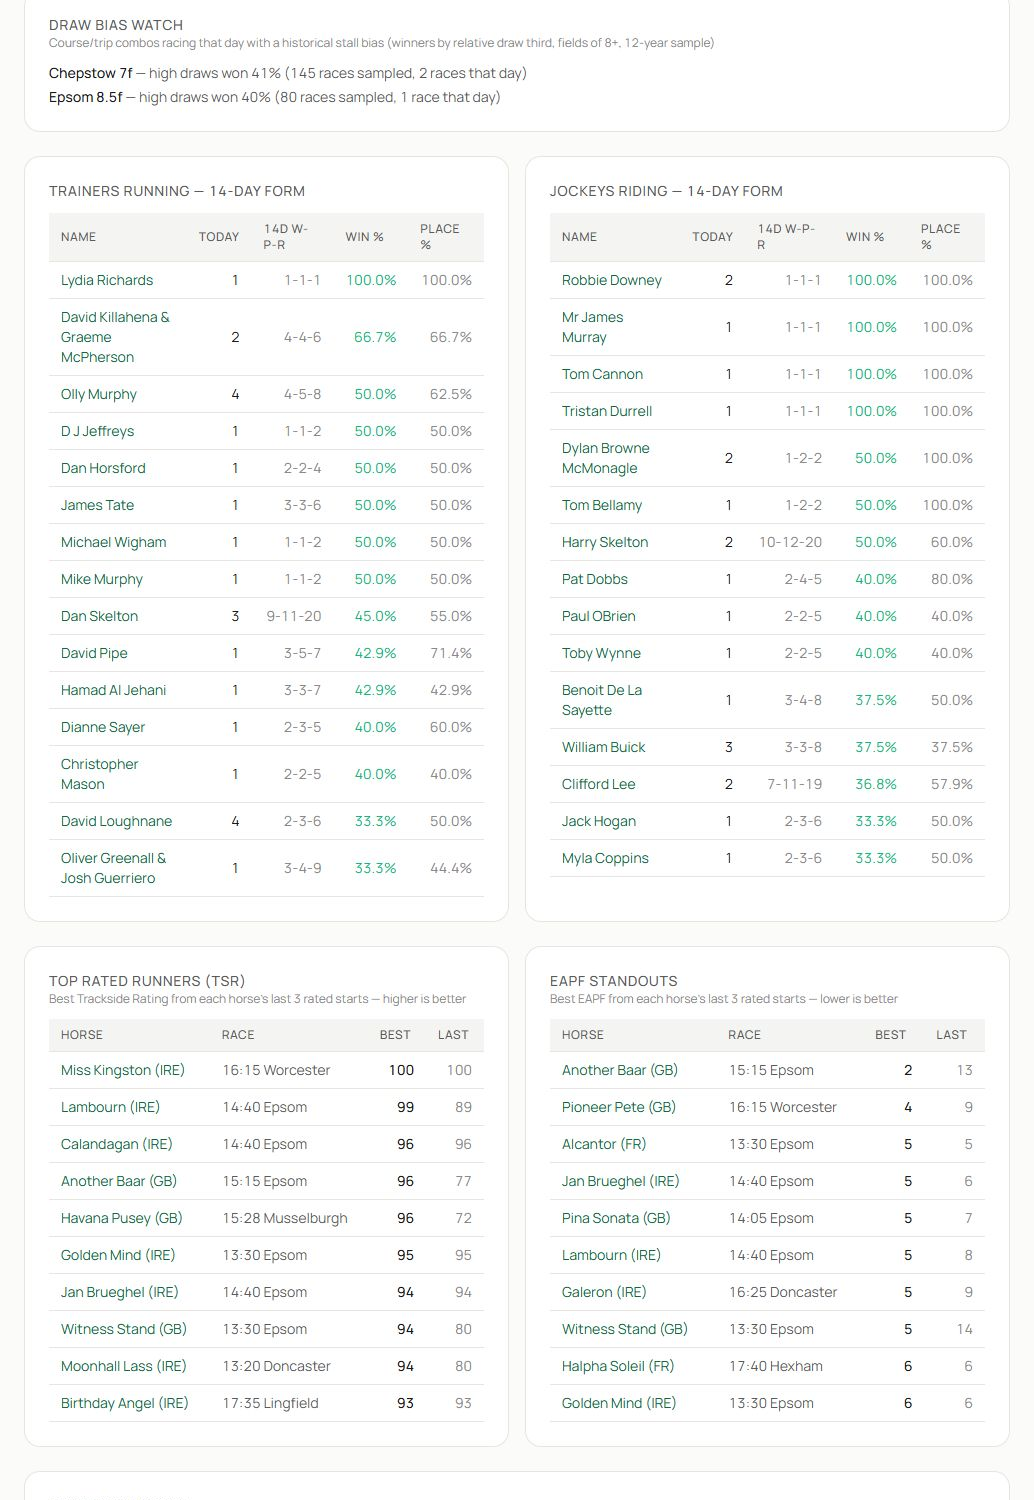
- Trainers Running — 14-day form ranks trainers represented on the card using their recent results.
- Jockeys Riding — 14-day form does the same for riders. Use runs, win rate and place rate together; a perfect percentage from one runner is not the same evidence as a strong rate across many runners.
- Top Rated Runners (TSR) shows the best recent Trackside Ratings among horses running that day. TSR is higher-is-better. Free members see the top three; Basic and higher plans unlock the complete list.
- EAPF Standouts shows the strongest recent EAPF figures. EAPF is lower-is-better, so the smallest number is the stronger performance.
Names and race times are links into deeper research. Open a horse, trainer, jockey or race when a row deserves context.
Use Regressive Watch carefully#
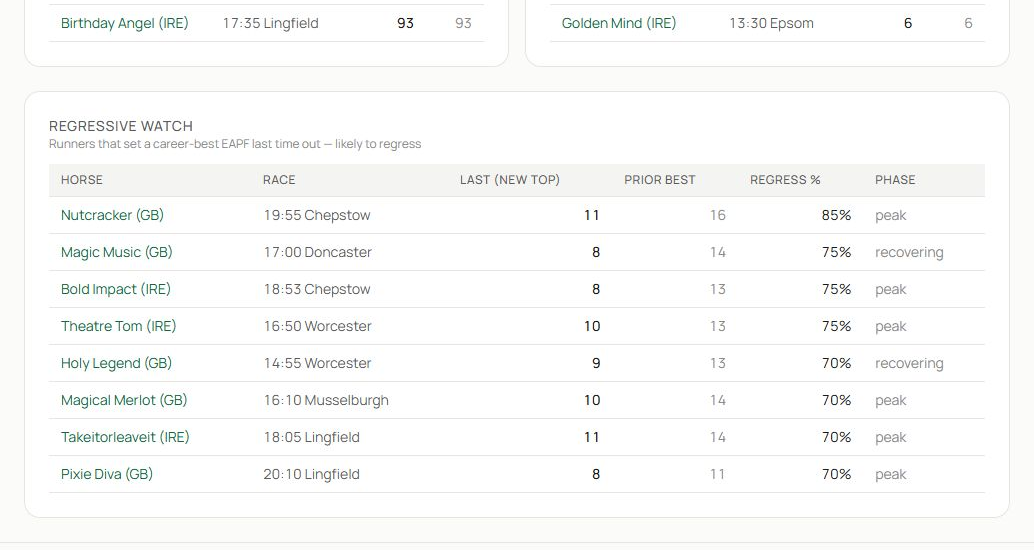
- Regressive Watch surfaces horses whose latest EAPF was a career-best or notably strong effort and may be difficult to reproduce immediately. The table compares the latest figure with the prior best and reports a regression percentage or cycle phase.
This is a risk flag, not a prediction that the horse must run poorly. Check recovery time, race conditions, age, trainer pattern and the horse speed sheet before drawing a conclusion.
A five-minute Dashboard routine#
- Confirm the date and number of meetings.
- Note any course in Draw Bias Watch.
- Scan trainer and jockey form, paying attention to sample size.
- Open the leading TSR and EAPF runners in separate tabs.
- Review Regressive Watch for possible short-priced risks.
- Continue to Today’s Card and inspect the races around the most interesting signals.
Related guides#
Use Today’s Card to open a racecard, Race Browser and Race Details for a result view, and Speed Figures and Speed Sheets before interpreting TSR or EAPF in depth.