
Begin with a clear hypothesis#
Write the idea in plain language before adding filters. For example: “Older horses at Goodwood drawn one to three.” A clear sentence makes it easier to spot a filter that does not belong and reduces the temptation to keep adding conditions until the history looks attractive.
Build the filter canvas#
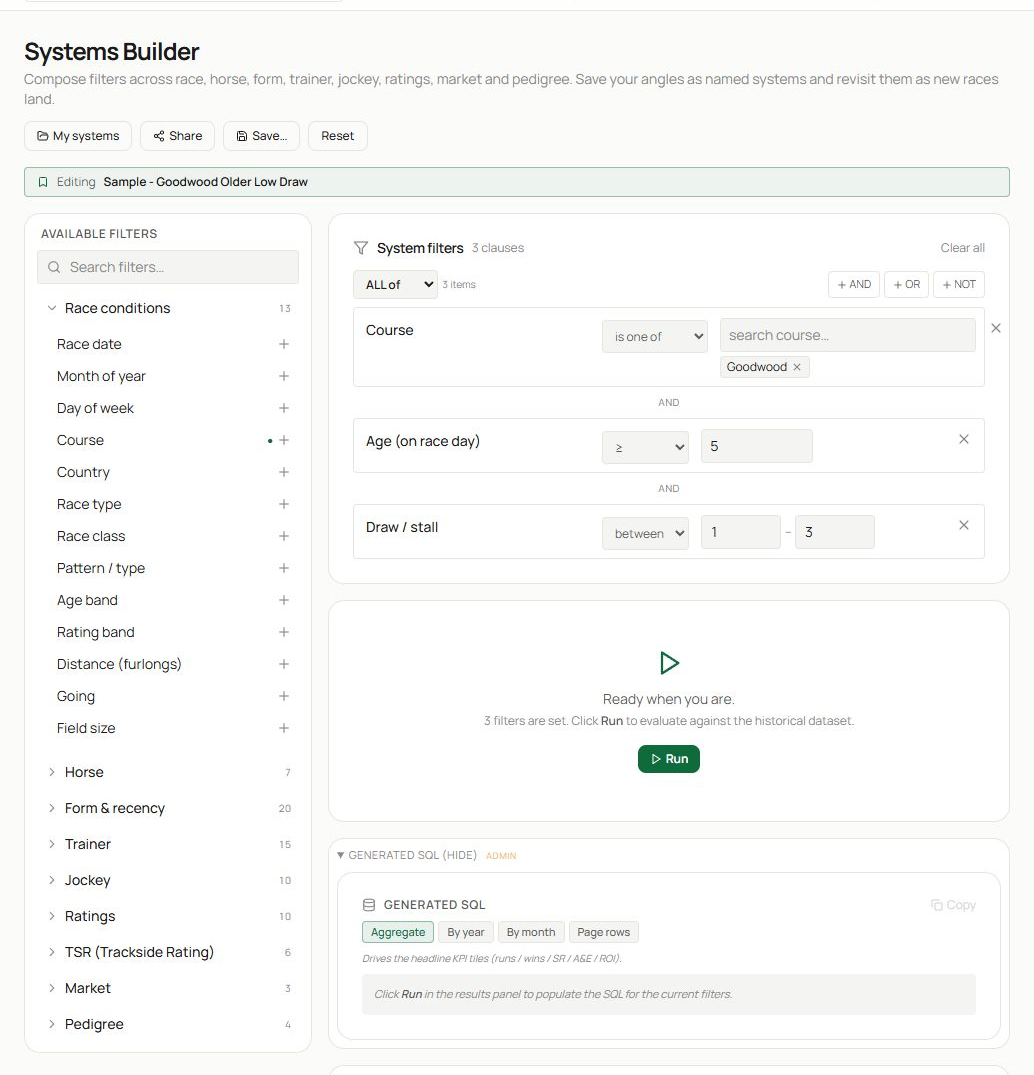
- The top actions open My systems, share, save or reset the current work. The green editing strip names a loaded system.
- Browse or search the filter palette on the left. Categories cover race conditions, horse factors, form and recency, trainers, jockeys, ratings, TSR, market and pedigree. Select the plus control beside a field to add it.
- Active clauses appear on the canvas. Set the operator and value for each. ALL of requires every clause; logical groups and AND, OR or NOT controls allow more complex definitions. Select Run when the system is valid.
In the example, the system requires Goodwood, age five or older and a draw between one and three. Read the natural-language hypothesis again and confirm that every clause matches it.
Use logical groups carefully#
- AND narrows the result because every connected condition must be true.
- OR broadens the result because either branch may be true.
- NOT excludes matches.
Build one group at a time and preview after each meaningful change. Deeply nested logic is harder to audit and easier to misunderstand later.
Evaluate the results#
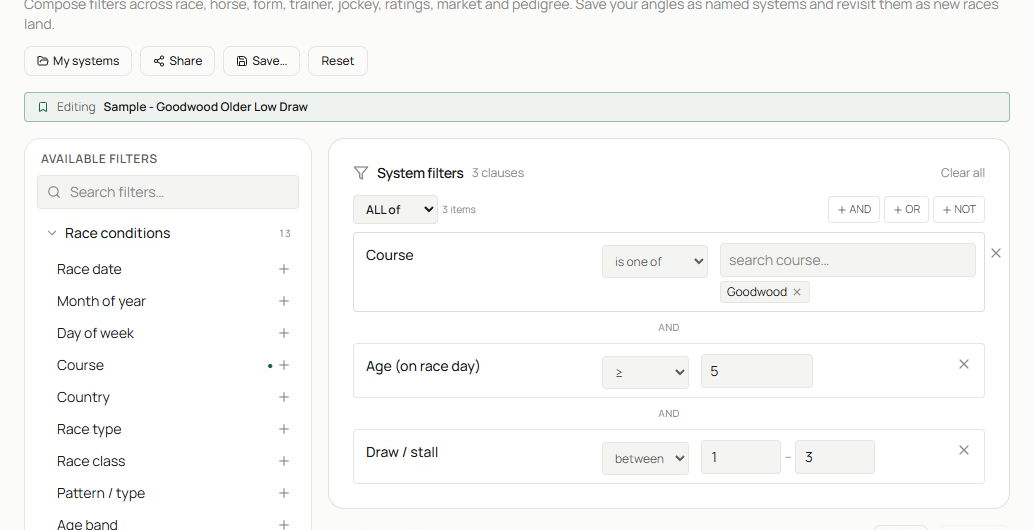
- Recheck the loaded filters before judging the numbers.
- The KPI tiles summarise runs, wins, place rate, A/E, impact value, PRB and ROI.
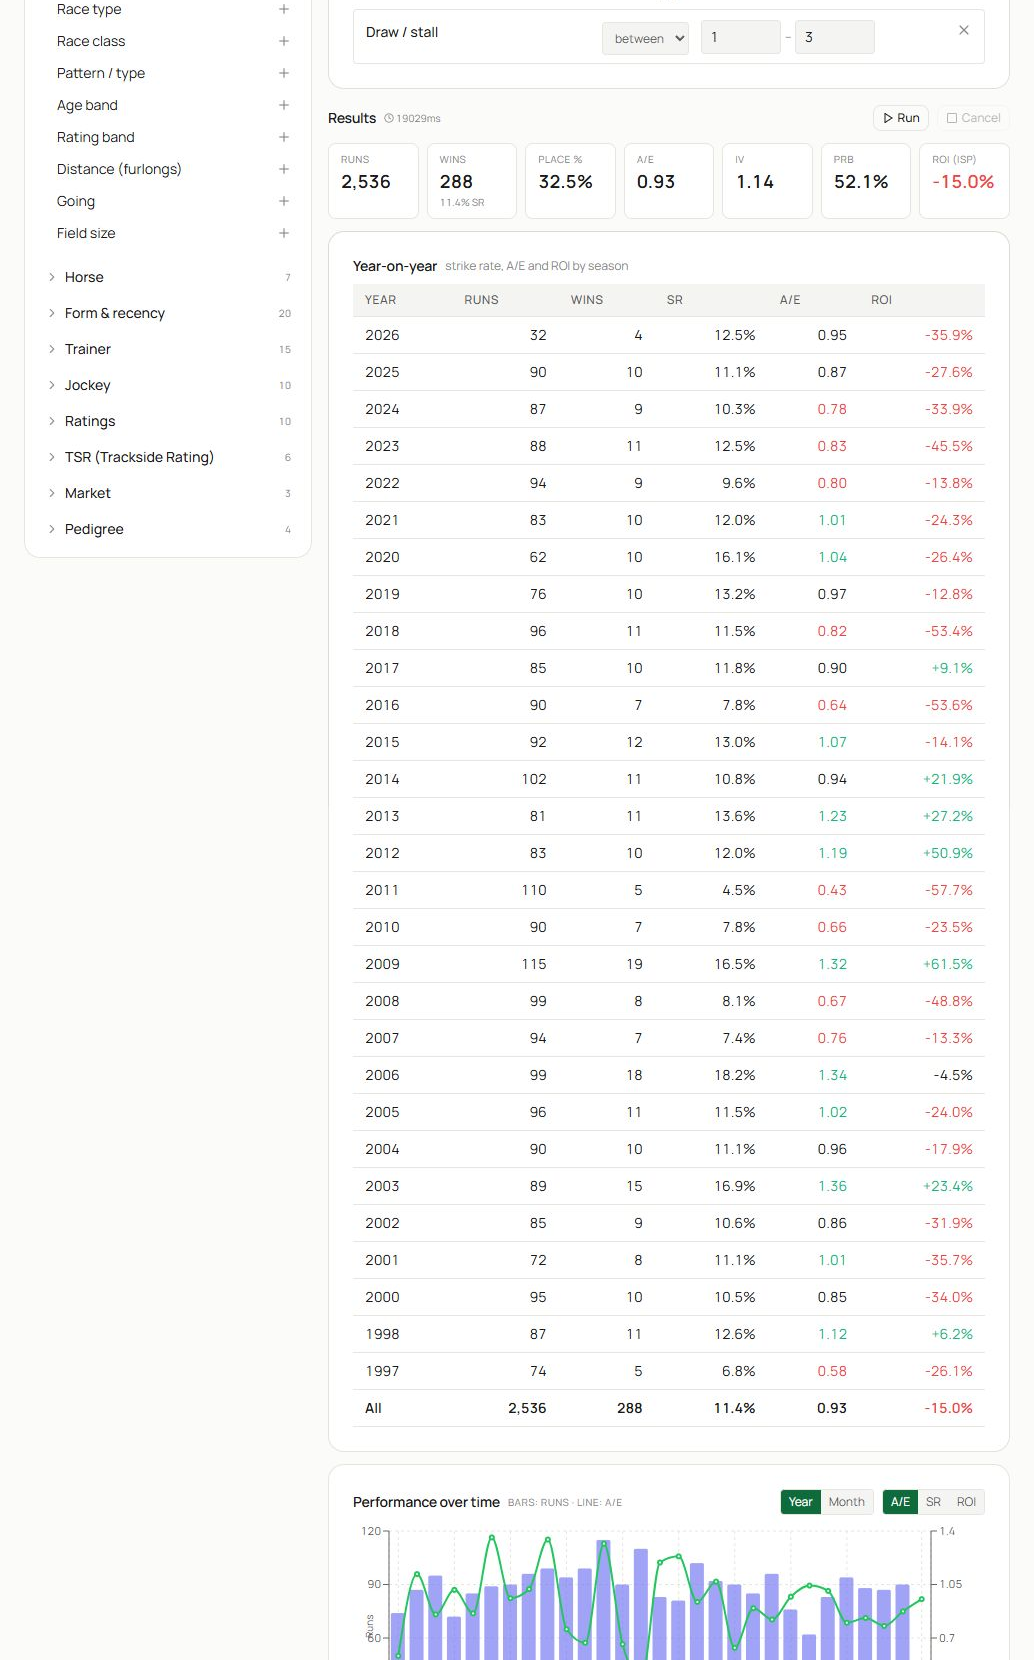
- The year-by-year table shows whether performance is stable or concentrated in a few seasons.
- The chart visualises changes over time. Use its switches to focus on A/E, strike rate, ROI or the available time grouping.
The main measures answer different questions:
- Strike rate is winners divided by runs.
- A/E compares actual with market-expected winners; 1.00 is market expectation.
- Impact value compares the system’s win rate with the wider baseline.
- PRB is the average percentage of rivals beaten; 50% is neutral.
- ROI is historical return on investment at the recorded pricing basis.
Expand Matching runs to audit individual selections. A plausible headline with implausible rows usually points to a filter-definition problem.
Save and manage systems#
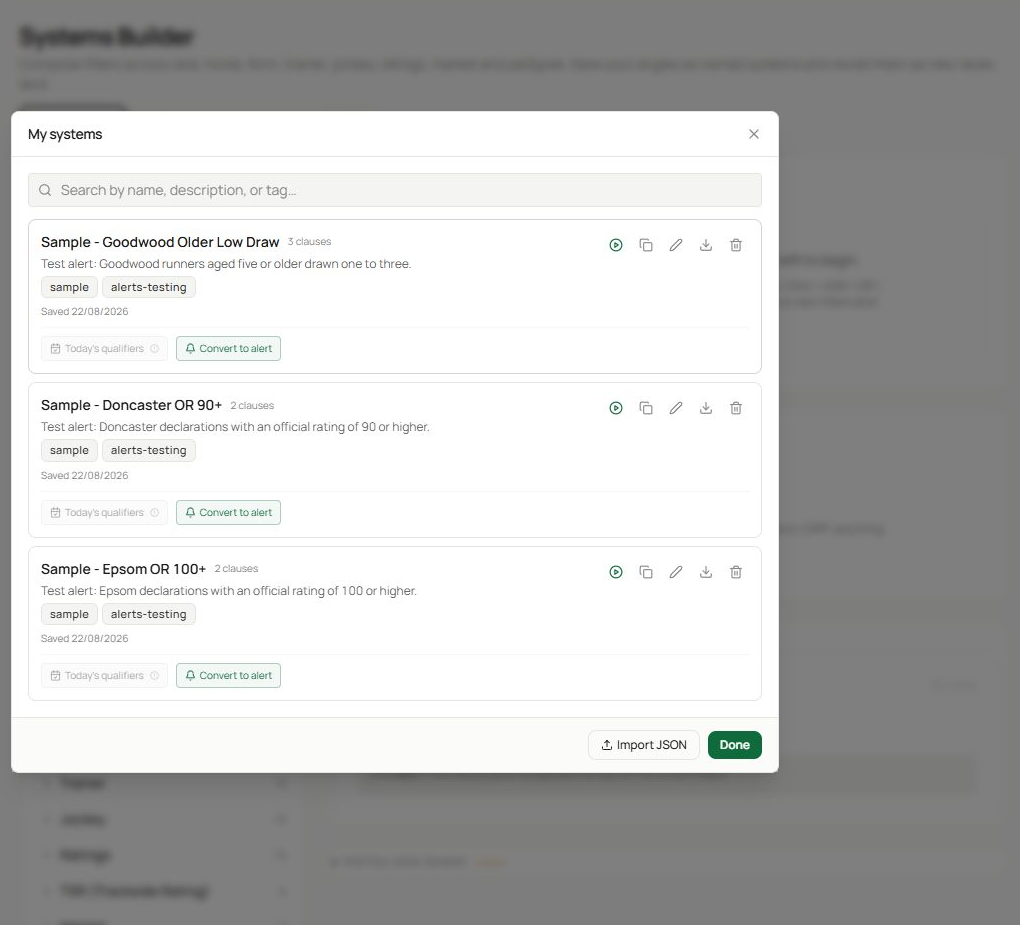
- Open My systems and search by name, description or tag.
- A saved row can be loaded, duplicated, edited, exported or converted to an alert when eligible. The shelf also provides JSON import for transfers.
Use a name that states the key angle and a description that records the hypothesis. Tags help group systems by course, code or research theme. Saving a system preserves its definition; it does not make the historical result permanent, because new racing data can change the evaluation.
Avoid common research traps#
- Do not add a filter only because it improves past ROI.
- Keep enough historical runs for the conclusion you want to make.
- Check performance by year, not just the all-time row.
- Audit matching runs for data or logic surprises.
- Prefer declaration-safe conditions if you intend to create an alert.
- Rerun saved systems periodically as new data arrives.
Related guides#
Use Course Analyser and connection profiles to develop a hypothesis, then see Alerts to monitor an eligible saved system on future cards.