
Use the trainer leaderboard#
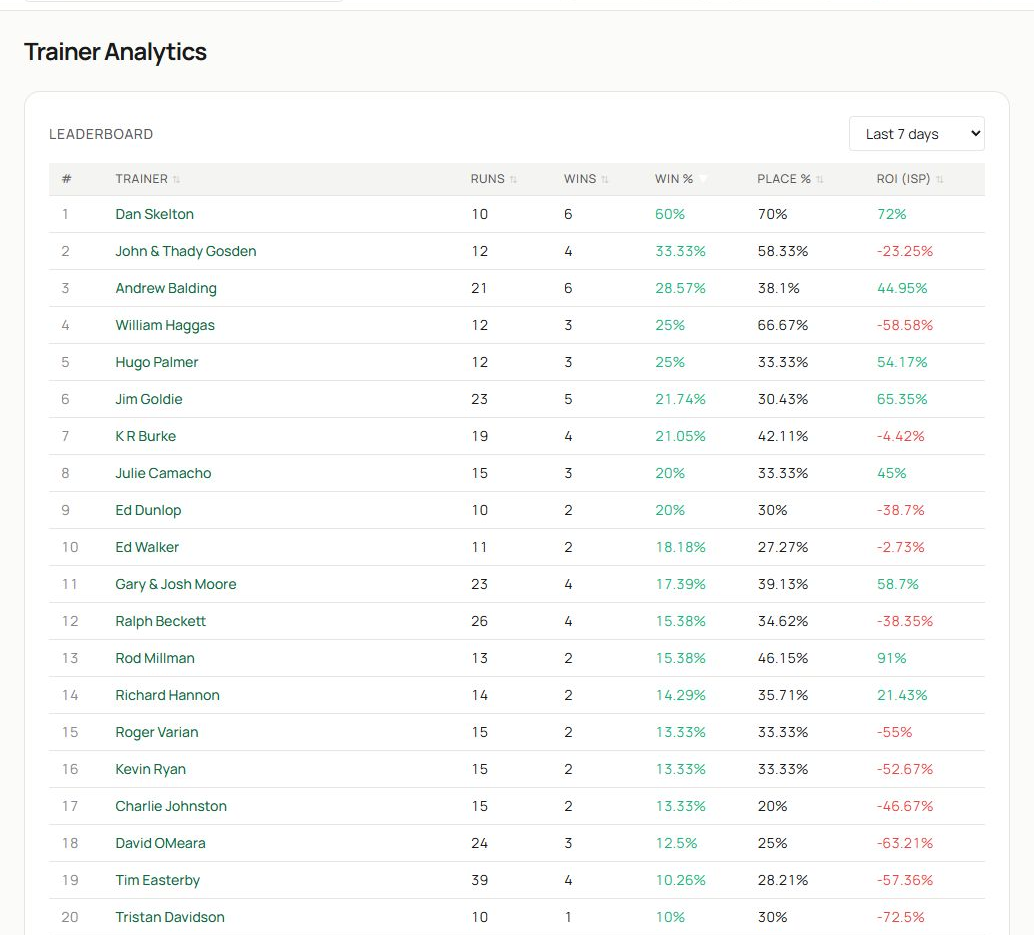
- Choose the form period from the control above the table. A short period is more responsive; a longer period usually provides a more stable sample.
- Compare runs, wins, win percentage, place percentage and return on investment. Select a trainer name to open the profile.
Do not rank trainers on win rate alone. A trainer with two wins from four runners and one with twenty wins from sixty runners have different levels of evidence. ROI can also be dominated by one large-priced winner.
Read a trainer profile#
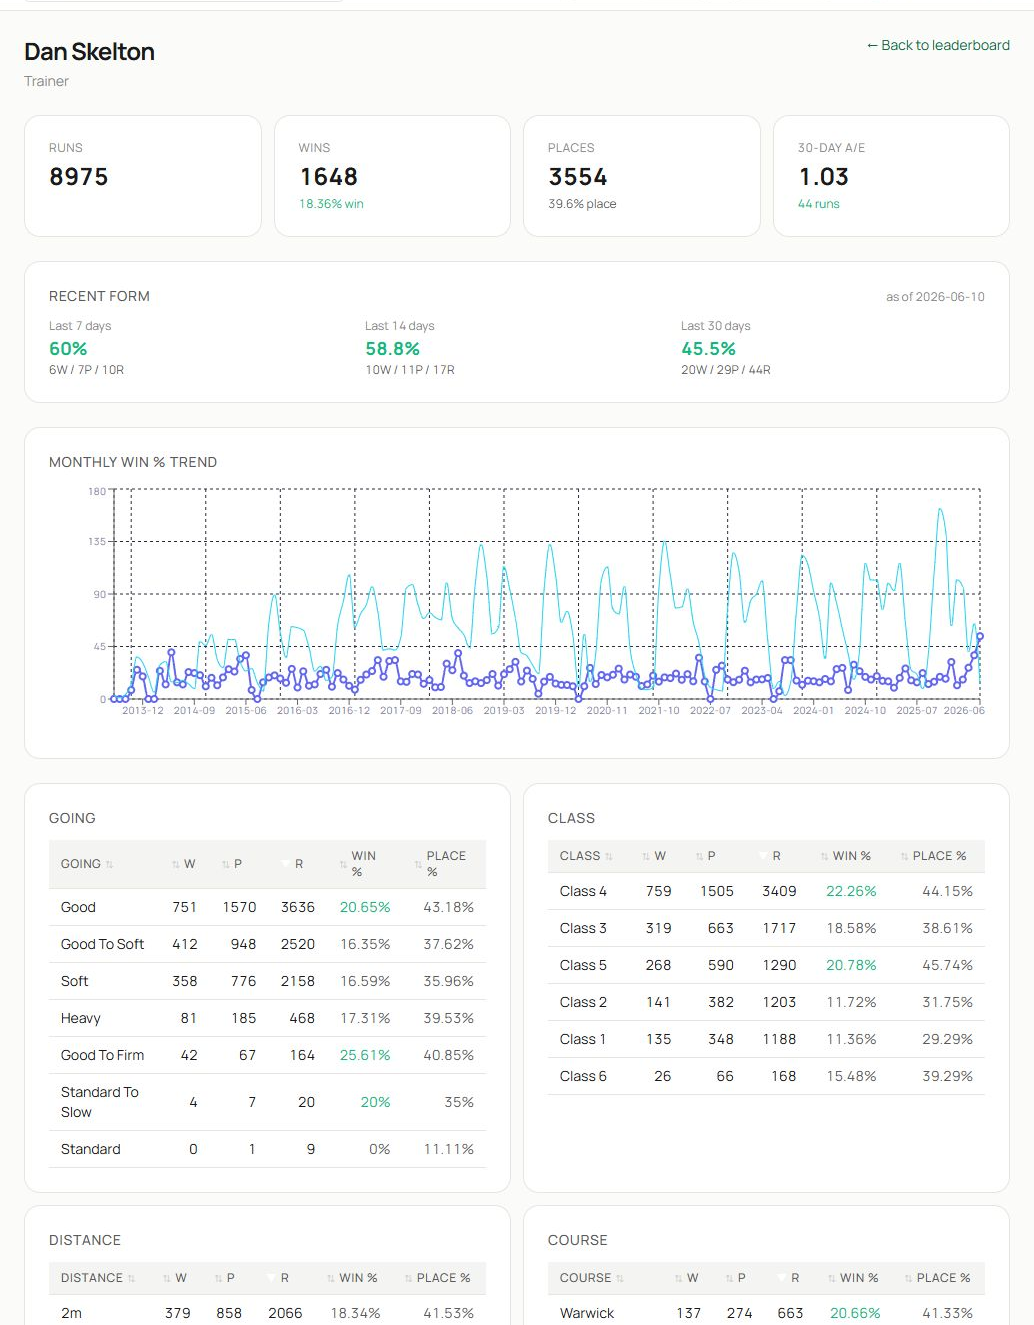
- The heading confirms the selected trainer and provides a route back to the leaderboard.
- Headline tiles show career runs, wins, places and the recent A/E indicator. Recent form panels compare the last 7, 14 and 30 days.
- The trend and breakdown tables show how results vary by going, class, distance, course and other available factors.
A/E compares actual winners with the number expected by the market. Above 1.00 means more winners than market prices implied; below 1.00 means fewer. Always check the run count and whether the pattern is recent or persistent.
Use the jockey leaderboard#
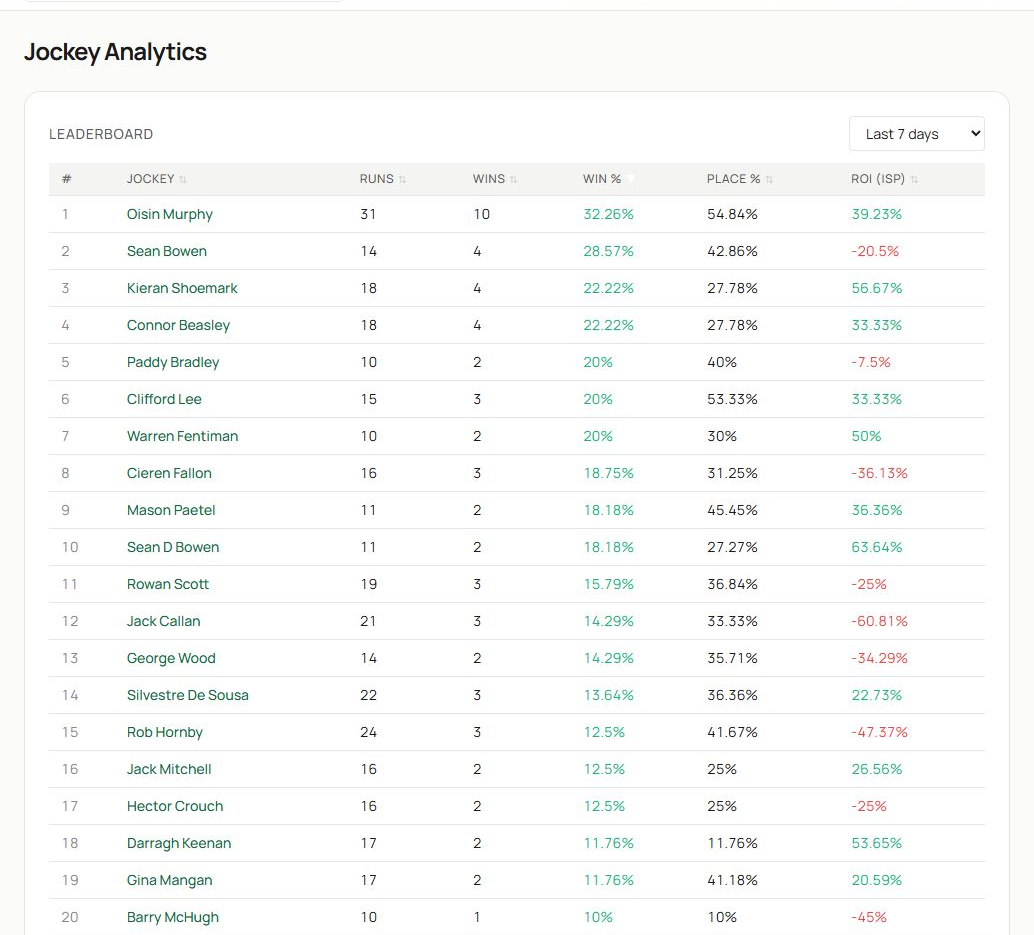
- Set the period you want to assess.
- Compare activity, wins, win rate, place rate and ROI. Select a jockey to open the profile.
The leaderboard is most useful for finding active riders who are both riding regularly and outperforming their recent market expectation. It is not a substitute for checking the horse or race.
Read a jockey profile#
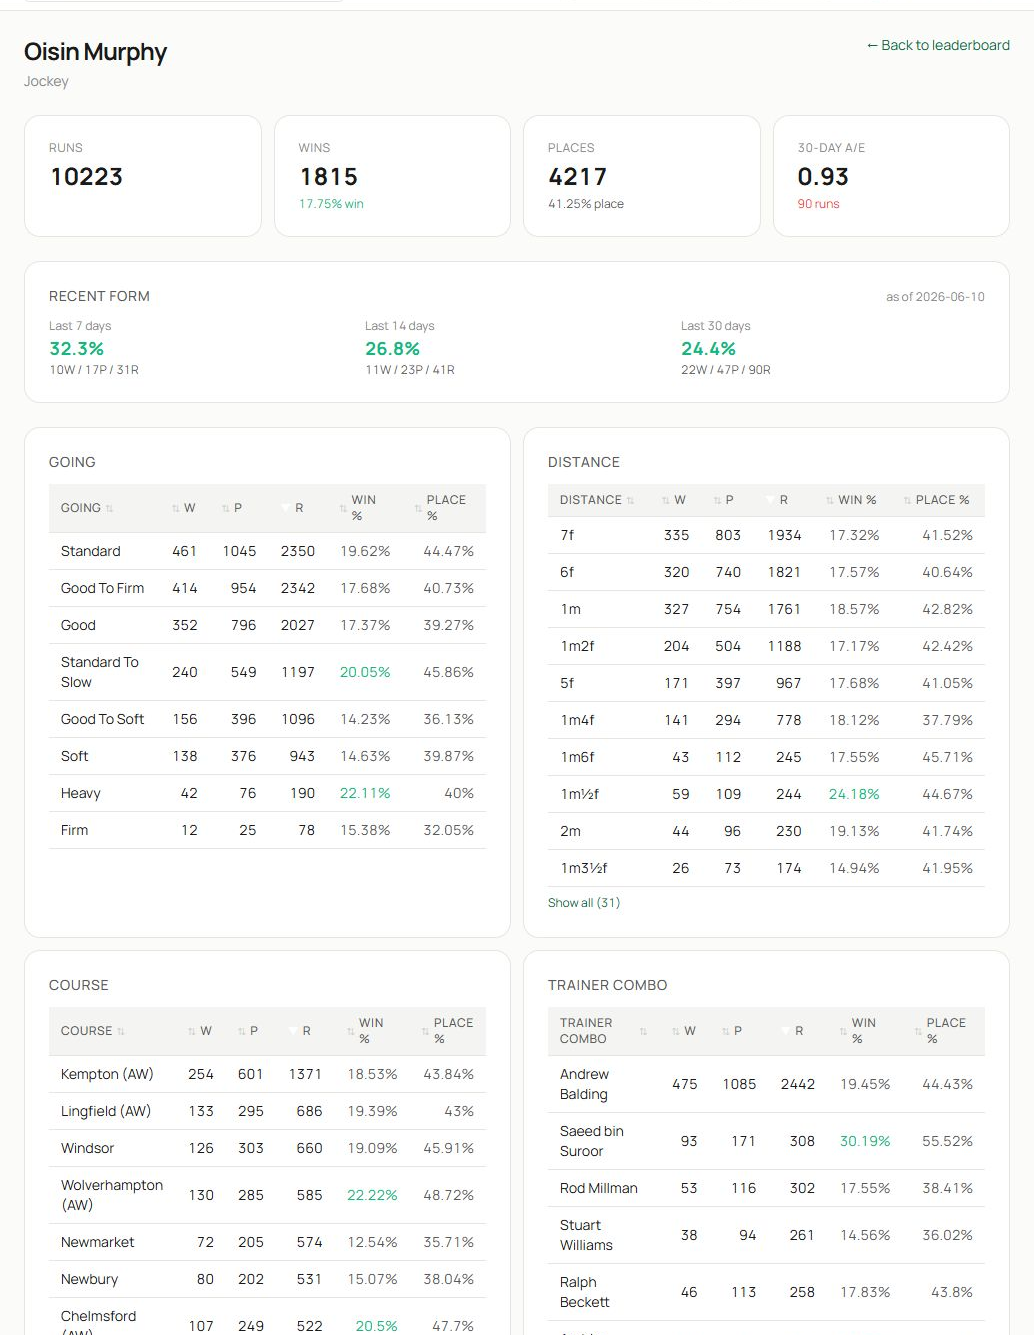
- Confirm the jockey at the top of the page.
- Review career totals and the recent A/E figure, then compare 7-, 14- and 30-day form.
- Use going, distance, course and trainer-combination tables to understand where results have been strongest.
Trainer–jockey combinations can be particularly useful, but they often contain fewer runs than the headline record. Read runs, wins, A/E, impact value and place measures together.
Compare connections sensibly#
- Select the same time period for every leaderboard comparison.
- Note the number of runners before comparing rates.
- Open the profile and look for the condition relevant to today’s race.
- Check whether the recent form agrees with the longer trend.
- Return to the racecard and judge the connection in the context of the horse, draw, pace and price.
Related guides#
Use Dashboard for connections represented on today’s card, Course Analyser for course-specific leaderboards and Systems Builder to test repeatable trainer or jockey conditions.